
- 89
- 2 236 021
Matthew E. Clapham
United States
Приєднався 13 кві 2014
Lecture material for EART101 (Invertebrate Paleobiology), EART120 (Sedimentology and Stratigraphy), and EART125 (Statistics and Data Analysis in the Geosciences) at the University of California, Santa Cruz.
17 - Delta environments
Prodelta, delta front, delta plain facies and environments; river-, wave-, and tide-dominated deltas
Переглядів: 252
Відео


8 - Alluvial fans
Переглядів 3932 місяці тому
Alluvial fan environments, debris flow rheology and sediment support mechanisms

1 Fluvial type
Переглядів 5412 місяці тому
Characteristics of modern meandering and braided rivers (channel morphology, bar types, and associated deposits)
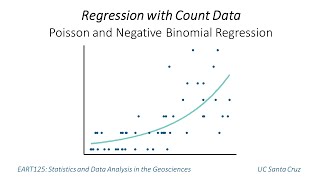
Regression with Count Data: Poisson and Negative Binomial
Переглядів 57 тис.3 роки тому
Poisson, quasi-Poisson, and negative binomial regression - when to do them and how you should choose the method. What are overdispersion and underdispersion, and why are they problems? How to deal with too many zero counts (zero-inflation) or when zero counts are impossible (zero-truncation). 0:00 Background 2:26 Poisson Regression: What and Why 7:05 Overdispersion: Quasi-Poisson or Negative Bi...

Linear regression
Переглядів 3,2 тис.3 роки тому
How ordinary least squares linear regression works and why to do it. Evaluating the assumptions of a regression model and interpreting the output in R.

Shapiro-Wilk test
Переглядів 25 тис.3 роки тому
The Shapiro-Wilk test to test for deviations from normality. Also includes an introduction to Q-Q plots, and how they can be used to graphically assess normality.
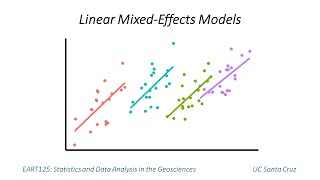
Linear mixed effects models
Переглядів 216 тис.4 роки тому
When to choose mixed-effects models, how to determine fixed effects vs. random effects, and nested vs. crossed sampling designs. Requirements and assumptions of mixed-effects models, and how to evaluate them. How mixed-effects models can improve parameter estimation with partial pooling/shrinkage.

Statistical power
Переглядів 4,6 тис.4 роки тому
The theory behind statistical power: what it is, what controls it, how you use it, and why you shouldn't calculate post-hoc power from your observed data.

Statistical testing procedures and the p value
Переглядів 2,4 тис.4 роки тому
The procedure for null-hypothesis statistical testing, including some of the philosophy behind the process. Definition and interpretation of the p value and statistical significance.
Time series and first differences
Переглядів 38 тис.5 років тому
Differencing data with first differences to perform regression and correlation with either stationary and non-stationary time series.
Factorial ANOVA
Переглядів 11 тис.5 років тому
Factorial (two-way) analysis of variance; evaluating main effects and interactions; balanced vs. unbalanced designs and the use of type II/III sum-of-squares for unbalanced designs. Note: the R code examples starting at 12:40 are switched: the left example should be phosphate*material and the right example should be material*phosphate.
21 - Parasequences and sequence boundary
Переглядів 15 тис.6 років тому
Definition of a parasequence and its relationship to sequence cycles. Terminology used in seismic profiles, such as the transgressive surface and sequence boundary.
Generalized least squares regression
Переглядів 29 тис.6 років тому
GLS regression for time-series data, including diagnosis of autoregressive moving average (ARMA) models for the correlation structure of the residuals.
Partial and semipartial correlation
Переглядів 31 тис.6 років тому
The theory behind partial correlation and semipartial correlation, including the goals and assumptions of the test.
29: Non-Metric Multidimensional Scaling (NMDS)
Переглядів 84 тис.8 років тому
29: Non-Metric Multidimensional Scaling (NMDS)
26: Resampling methods (bootstrapping)
Переглядів 146 тис.8 років тому
26: Resampling methods (bootstrapping)
18: Pearson product-moment correlation
Переглядів 4,1 тис.8 років тому
18: Pearson product-moment correlation
Excellent, had to search through several videos before landing on yours. A very clear and concise explanation on partial correlations.
Thanks Matthew for ShareThis
thanks a lot
this video is incredible, thank you so much!
this is really helpful. thank you so much!
very good explanation!
Thank you so much, an example on the last part "Working with time series" would be very useful.
can I find somewhere examples of random coefficient models where the variable of the random coefficient is not continuous but categorical? ideally written with STATA or SPSS?
Can you please explain why time series are not allowed? This would make the residuals non-independent of one another, but why does this invalidate the test? Would a LMM work better in this case, and if so would “time” as the continuous independent variable be the random effect to account for resampling of the same system? Thank you!
OMG, thank you so much for this very informative video, it really helped me a lot!
Super simplified, very help. Thank you!
Are LMM and LMEM the same thing?
Where does the observed difference at ~6:00 come from?
Thank you for making this video it really clarified the concepts for me
It's remarkable how inept professors are at explaining the simplest of concepts. You have surpassed most of mine, thank you very much.
Well this is an applied statistics course, so it's way more useful than most theoretical ones
I truly enjoy watching this tutorial. Thank you
Thank you very much! This helped me quite a lot!!
Is that Dr. Bob D pointing at the outcrop.
Indeed - an old photo I scanned from one of the New York fall field trips!
Thank you sir, it was very well explained.
Excellent work
6:45
You state "Dune size scales with flow depth; ripples scale with grain size instead". There are what are known as mega-flood ripples (such as the Camas Prairie ripples). These are over 30 feet high. Were they scaled up as a result of grain particle size? Or flow depth? Surely they scaled up in size due to flow depth.
Oh my goodness, thankyou for making a video that actually explains statistical content clearly! If I had a dollar for every video with a title like, "such and such analysis method, CLEARLY EXPLAINED!" then goes on to dive into the most complex content imaginable without proper explanation I'd be a very rich man. Sorry about this vent, I'm just very appreciative. Keep up the good work.
at 3:18, shouldn't it be Yt and Yt-1 rather than x?
This story seems straight forward - yet, after 8 minutes I still am clueless as where it is going to lead. Maybe it is just me, but when I need to learn something, I don't want a long tension arc: Oh, what is going to happen next... I want to start with a great picture of what is going to happen, and then fill in the details one after another, so I can sit and marvel, how the big initial problem step by step dissolves into smaller and understandable pieces. Inversing the story, starting from the conclusion, going to the basics also allows to stop once you understood enough.
Really clear. Thanks!
Fantastic video! Thank you so much! You are the best!
best!
Excellent. Thank you
very helpful, thank you!
Could not have gotten confused even if i tried to, really clear explanation
Amazing explanation!
This is fantastic. I'm a software engineer currently learning about why our cosine similarity functions aren't doing so hot on our large embeddings vector for a large language model. This helps me understand what's happening behind the scenes much better. Thank you!
Really good explanation! Helping me write my first manuscript :)
Great summary, thanks Matthew
Holy fuck is this video good
How to calculate the p value(probability of the distance) in R manually? I don't want to use the function ks.test
Really great - i like the nod to regressions. Our Professor was not very good at explaining that the name Anova is somewhat vague or more a Header-name for different tools. And i got confused when everything was called Anova yet the approaches were somewhat different
Concise and right to the point. I love it. Thanks.
Country X has 30 states with repeated observation measures of X across 15 years for each state. Is Mixed Effects appropriate to model Y from X with states as random effects?
Legend
are you sure it is not possible to do the Hotelling T2 Test in within-desgings? My professor told me to do the test, even though the same group of people did multiple tests on 2 different days.
Hi Matthew, what sources did you use in this video? specifically what sources did you use to distinguish the difference between a ripple and dune?
I am new to this model and I have to say that this video is really helpful! Thanks!
The bext explanation I've found, thank you!